Maps
Topological Maps
All topological constructions use bats.CellularMap to represent topological maps.
To specify a CellularMap, you need to provide a map for cells in each dimension. These should be stored as bats.IntMat, which provide oriented boundaries. First let’s define a CellComplex representing the circle with 2 vertices and 2 edges.
import numpy as np
import bats

X = bats.CellComplex()
X.add_vertices(2)
X.add([0,1],[-1,1],1)
X.add([0,1],[1,-1],1)
We can verify that X has the expected betti numbers mod-2
X2 = bats.Chain(X, bats.F2())
R2 = bats.ReducedF2ChainComplex(X2)
print(R2.hdim(0), R2.hdim(1)) # 1, 1
Now, we’ll define a map from the cell complex to itself, via a doubling. Each vertex maps to (0), and each edge maps to the sum of edges
import scipy.sparse as sparse
M = bats.CellularMap(1)
M0_dense = np.array([[1,1],[0,0]])
A = sparse.csc_matrix(M0_dense)
M[0] = bats.Mat(bats.CSCMatrix(*A.shape, A.indptr, A.indices, A.data))
M1_dense = np.array([[1,1],[1,1]])
A = sparse.csc_matrix(M1_dense)
M[1] = bats.Mat(bats.CSCMatrix(*A.shape, A.indptr, A.indices, A.data))
M now contains the map that we want to represent. We can now apply the chain functor
M2 = bats.Chain(M, bats.F2())
And to compute induced maps, we need to supply a ReducedChainComplex for both the domain and range of the map. We computed these above. The output is a bats column matrix.
for dim in range(2):
    Mtilde = bats.InducedMap(M2, R2, R2, dim)
    print(Mtilde.tolist()) # [[1]], [[0]]
Note the doubling map on the circle creates the zero map on H1.
Algorithmic Constructions
There are a variety of common situations in which a CellularMap can be constructed algorithmically. bats provides a SimplicialMap and CubicalMap for SimplicialComplex and CubicalComplex types.
SimplicialMap
A simplicial map \(f\) is extended from a map on zero-cells of simplicial complexes. Let’s create a noisy circle data set for example.
import numpy as np

def gen_circle(n, r=1.0, sigma=0.1):
    X = np.random.randn(n,2)
    X = r * X / np.linalg.norm(X, axis=1).reshape(-1,1)
    X += sigma*np.random.randn(n, 2)
    return X

np.random.seed(0)

X = gen_circle(200)
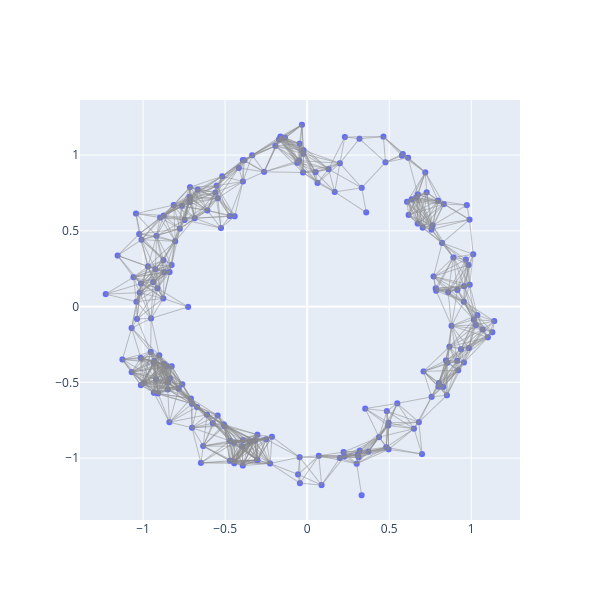
Now we’ll create a SimplicialComplex using the Rips construction
from bats.visualization.plotly import ScatterVisualization
import scipy.spatial.distance as distance

pdist = distance.squareform(distance.pdist(X, 'euclidean'))

R = bats.RipsComplex(bats.Matrix(pdist), 0.25, 2)
fig = ScatterVisualization(R, pos=X)
fig.update_layout(width=600, height=600, showlegend=False)
fig.show()
We now can create an inclusion map (identity map) via
f = bats.SimplicialMap(R, R)
Now, we can compute the induced map on homology to see we get the identity on H1:
R2 = bats.ReducedChainComplex(R, bats.F2())
F2 = bats.Chain(f, bats.F2())
Ftil = bats.InducedMap(F2, R2, R2, 1)
Ftil.tolist() #  [[1, 0], [0, 1]]
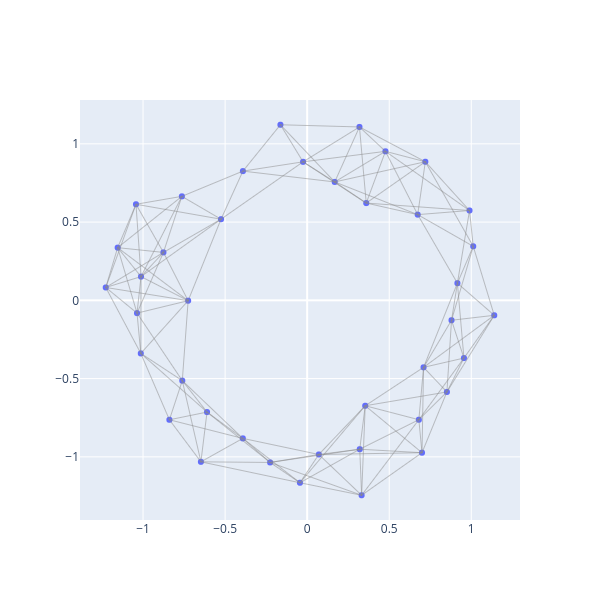
Let’s now do a non-inclusion SimplicialMap. We’ll get a greedy cover of the data, and threshold to k points.
We’ll construct a new Rips complex, where the parameter is increased by twice the Hausdorff distance to the full set.
k = 40
inds, dists = bats.greedy_landmarks_hausdorff(bats.Matrix(pdist), 0)
inds = inds[:k]
eps = dists[k-1]
eps # hausdorff distance from subset to total data set

Xk = X[inds]
pdist_k = np.array(pdist[inds][:,inds], copy=True)
Rk = bats.RipsComplex(bats.Matrix(pdist_k), 0.25 + 2*eps, 2)
fig = ScatterVisualization(Rk, pos=Xk)
fig.update_layout(width=600, height=600, showlegend=False)
fig.show()
We’ll now define a map from the full data set to the sub-sampled data by sending points to their nearest neighbor
from scipy.spatial import cKDTree
tree = cKDTree(Xk)
ds, f0 = tree.query(X, k=1)
f0 is now the map for vertices of R to vertices of Rk. We can extend the map
f = bats.SimplicialMap(R, Rk, f0)
Now, we can go through the process of computing the induced map on homology
Rk2 = bats.ReducedChainComplex(Rk, bats.F2())
F2 = bats.Chain(f, bats.F2())
Ftil = bats.InducedMap(F2, R2, Rk2, 1)
Ftil.tolist() # [[0, 1]]
We see the small H1 generator is killed.
We can visualize this (See visualization for details).
from bats.visualization.plotly import MapVisualization
fig = MapVisualization(pos=(X, Xk), cpx=(R, Rk), maps=(f,))
fig.show_generator(0, color='green', group_suffix=0)
fig.show_generator(1, color='red', group_suffix=1)
fig.show()
Generator
CubicalMap
Right now, bats.CubicalMap only supports inclusions - syntax is the same as that for bats.SimplicialMap, but inputs are bats.CubicalComplex objects.